The Evolution of AI Data Center Cooling | Case Study
Shifting sustainability burdens from energy-centric to thermal-fluid ecosystems

Info
- Researcher
- Professor Navid B. SalehCivil, Architectural and Environmental EngineeringUniversity of Texas, Austin
- Art Direction & Visual Design
- Asif Hossain
- Year
- 2026
Project Overview & Context
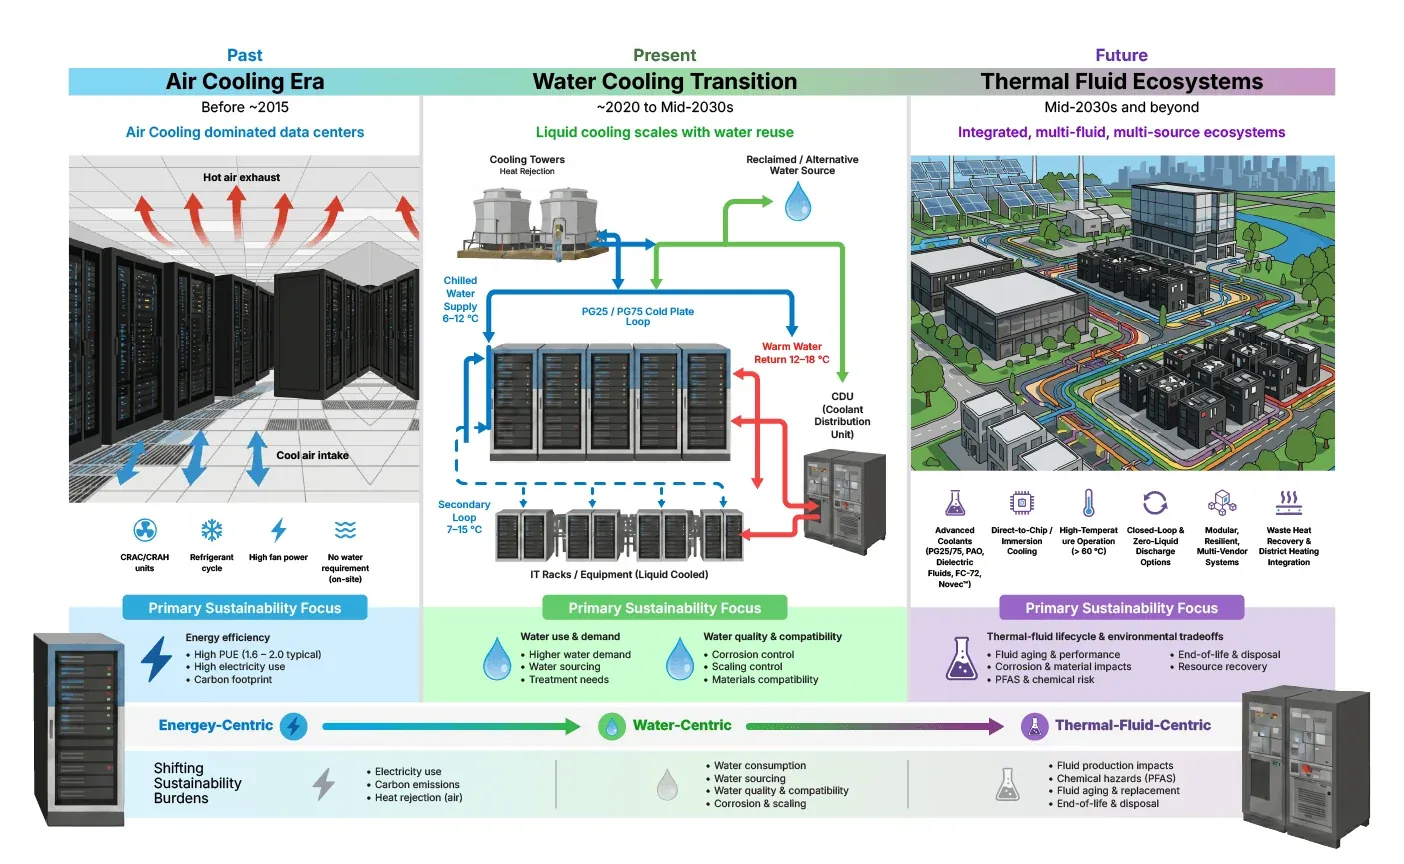
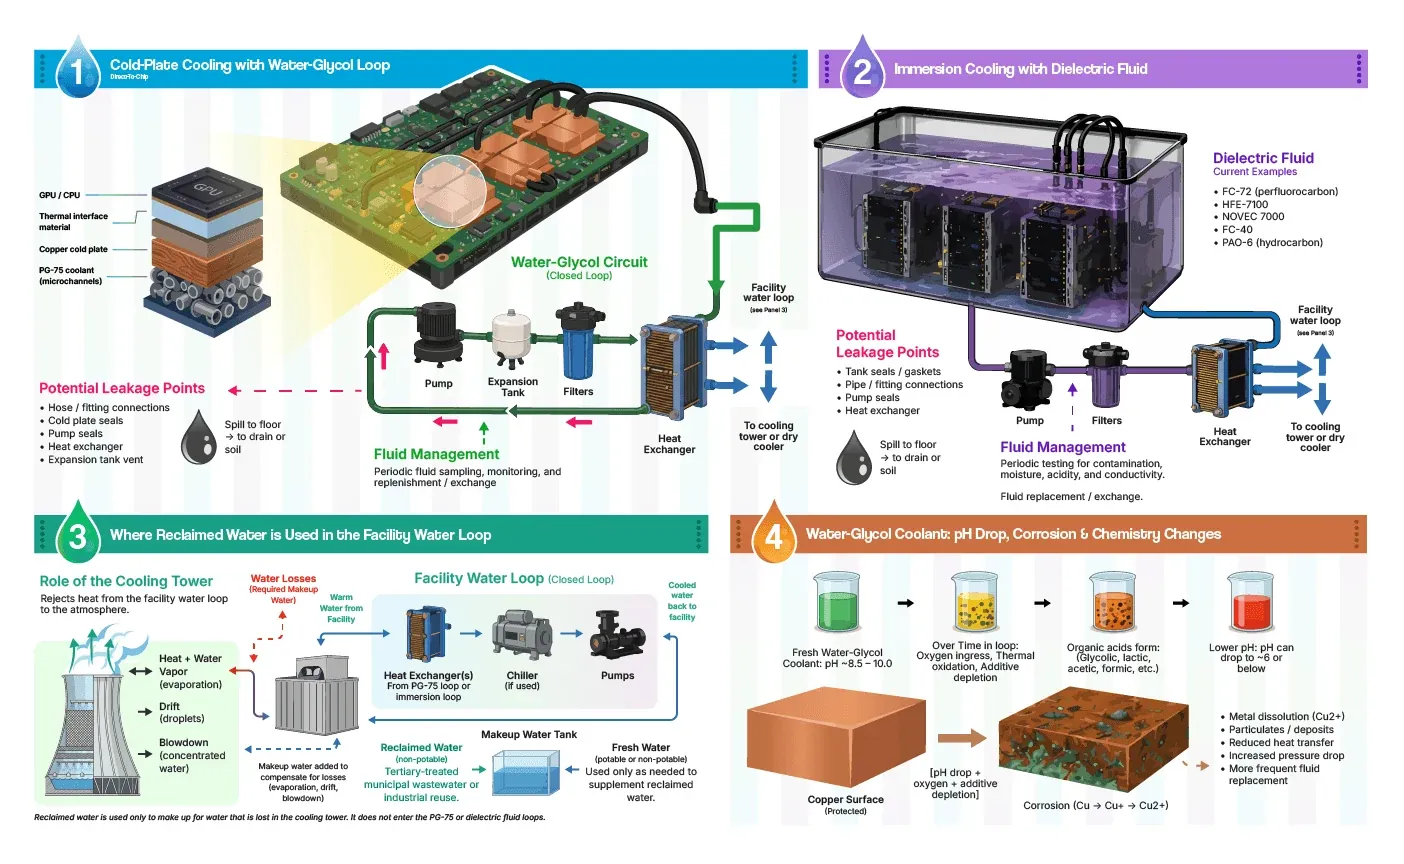
As AI infrastructure scales, data center cooling is undergoing a massive, rapid paradigm shift. This two-part infographic series visualizes the industry's historical transition from traditional air cooling to liquid cooling, and ultimately to advanced thermal fluid ecosystems. It bridges the macro-level evolution of data center architecture with the micro-level realities of chemical degradation and fluid management.
Challenge
- Managing Narrative Scope: Mapping a massive facility-level timeline (past, present, and future) while simultaneously explaining highly technical, micro-level closed-loop plumbing and thermodynamics within a unified visual family.
- Visualizing "Invisible" Threats: Illustrating how solving the "energy" problem introduces new, microscopic risks—specifically showing how fluid aging, pH drops, and invisible chemical corrosion pose severe sustainability and hardware threats to multi-million dollar GPU setups.
Target Audience & Goals
Geared toward data center architects, environmental engineers, and tech policymakers. The goal is to clearly illustrate that the transition to liquid cooling isn't a perfect silver bullet—it shifts the primary sustainability burden from electricity consumption to water sourcing and hazardous chemical (PFAS) disposal.
Design System
- Color-Coded Timeline: Employed a distinct three-color foundational block system (cool cyan for Air, pale green for Water, soft purple for Thermal Fluids) to immediately orient the viewer across the temporal layout.
- Thermal Gradient Pathways: Strict, universal adherence to red (hot exhaust/warm return) and blue (cool intake/chilled supply) arrow systems to make complex heat rejection loops instantly readable across both boards.
- Evolving Iconography: Developed a custom iconography set along the bottom axis (lightning bolt for energy, water drop for water, beaker for thermal-fluids) to track how the primary sustainability focus physically shifts across eras.