AI Infrastructure is Becoming Water Infrastructure
Why water demand is no longer enough: Rethinking sustainability in AI data centers
Info
- Researcher
- Professor Navid B. SalehCivil, Architectural and Environmental EngineeringUniversity of Texas, Austin
- Art Direction & Visual Design
- Asif Hossain
- Publication
- American Chemical Society
- Year
- 2026
Project Overview & Context
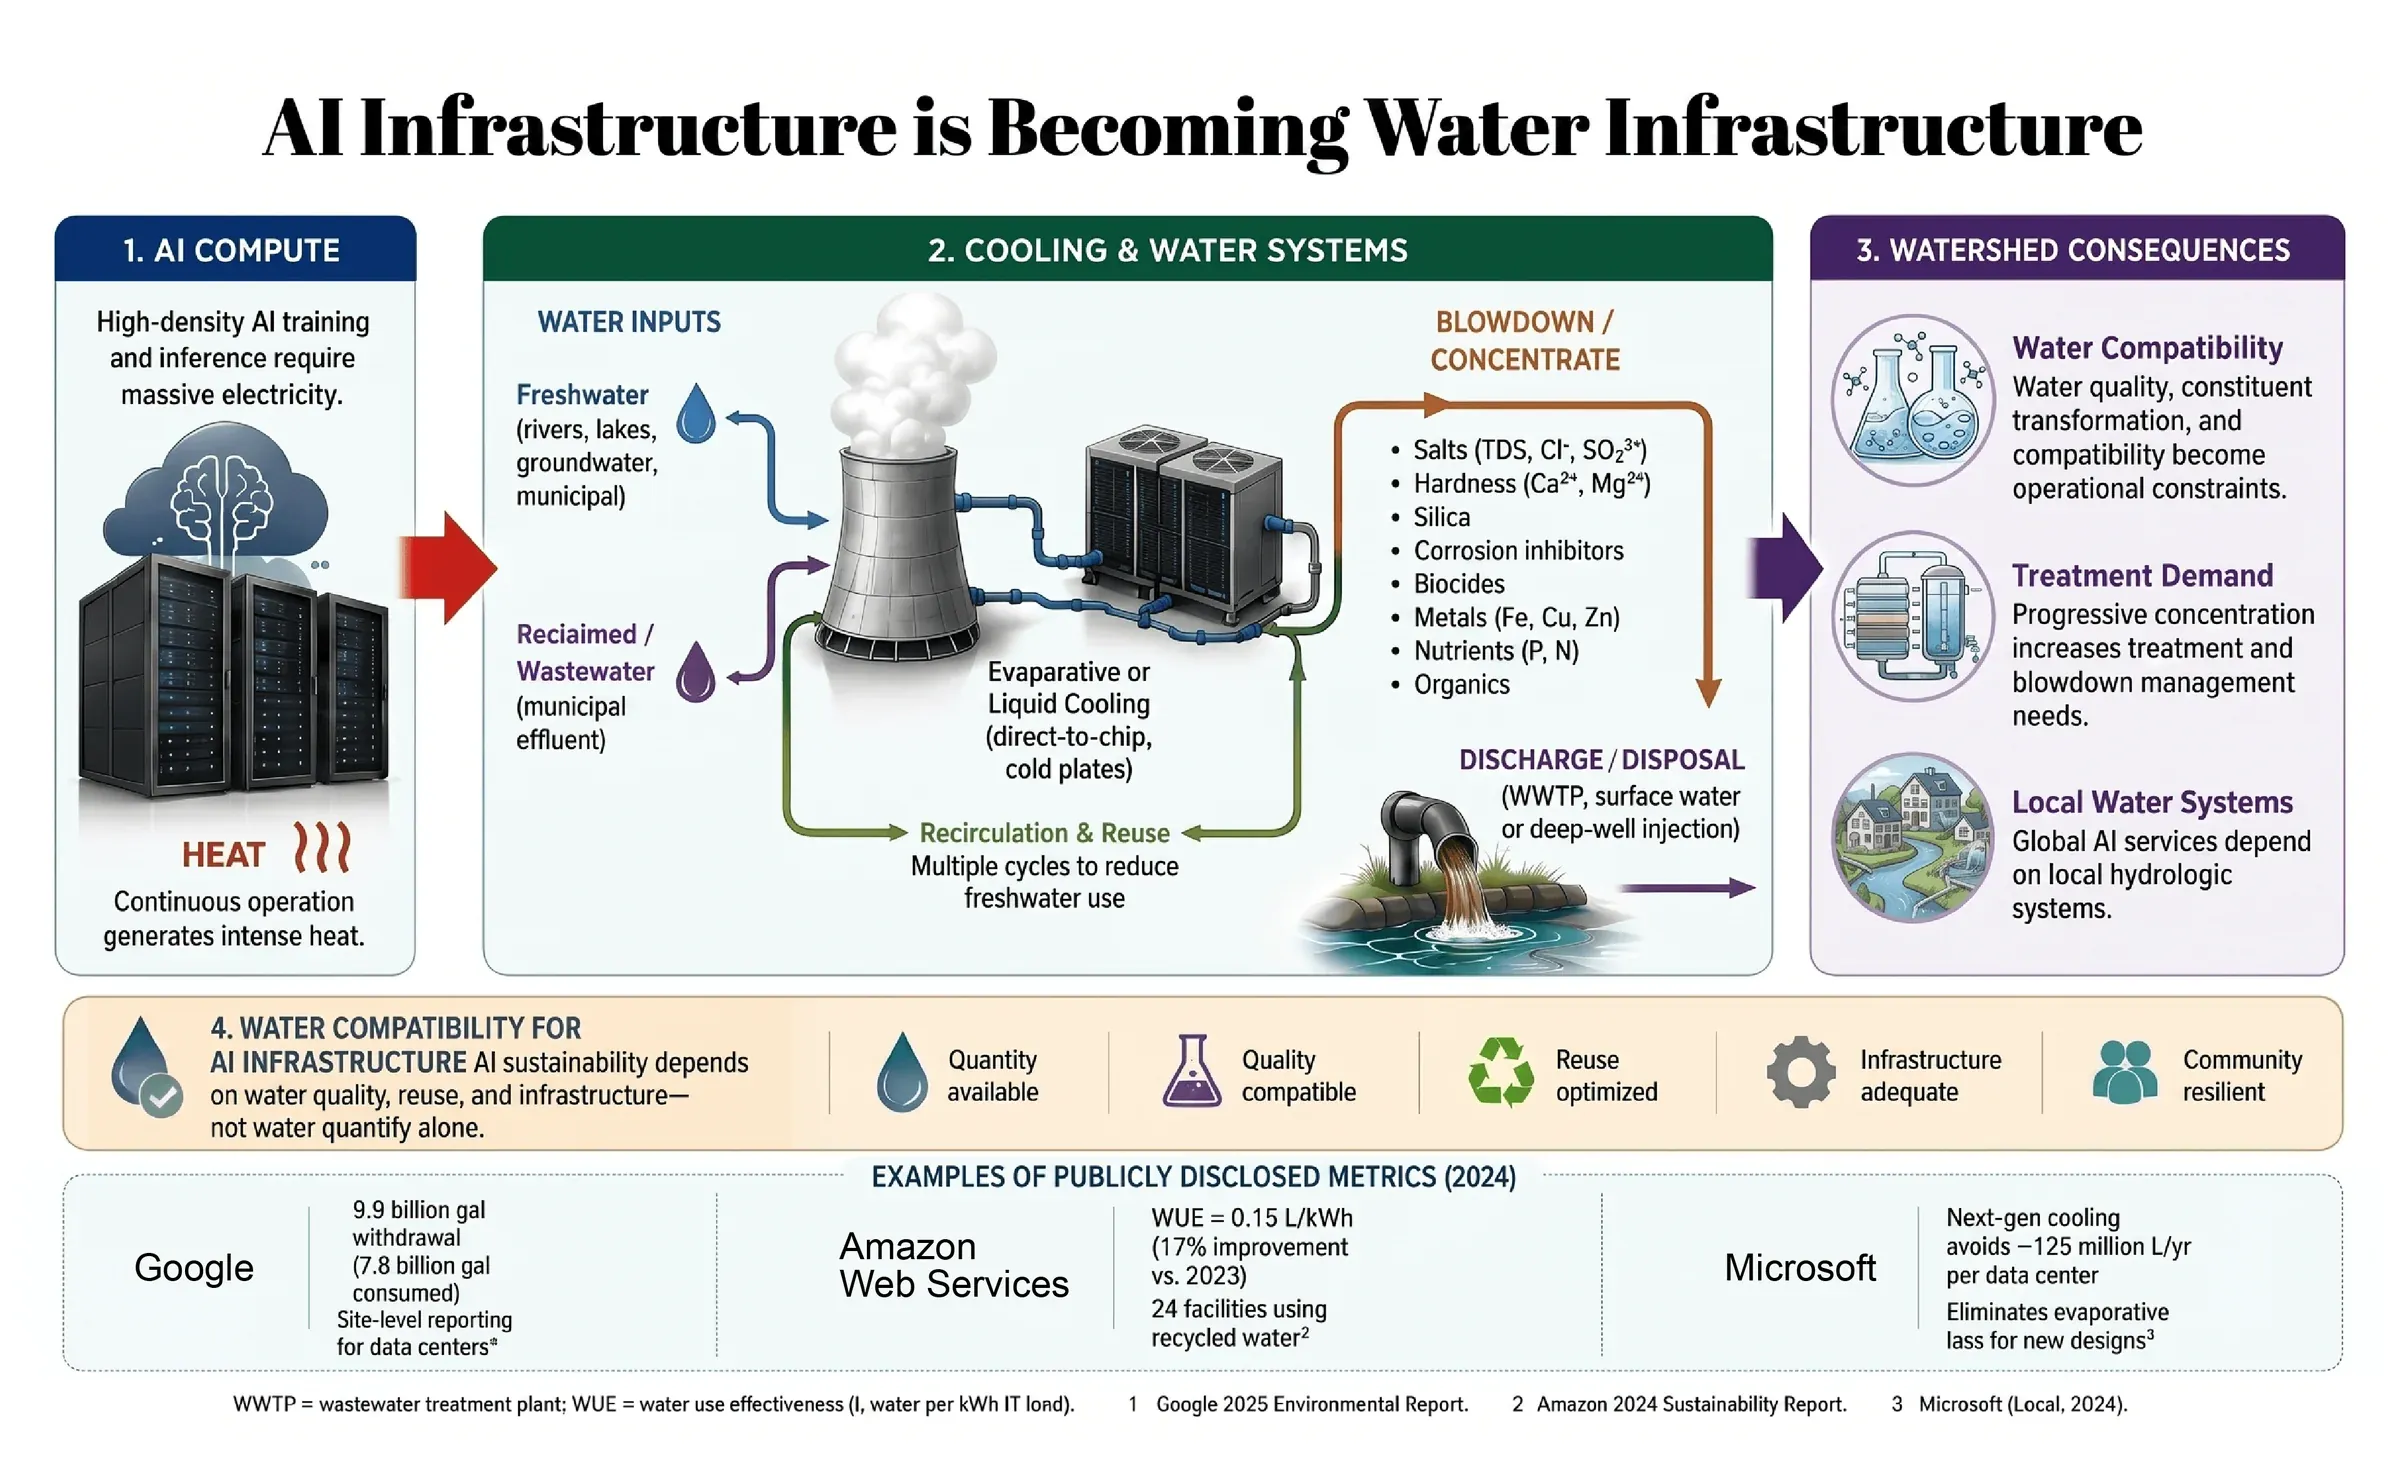
The global expansion of high-density AI computing generates immense heat, securely coupling digital AI infrastructure to physical hydrologic systems. Published as the central figure in an Environmental Science & Technology viewpoint by Prof. Navid B. Saleh, this infographic visualizes a critical paradigm shift: as data centers increasingly rely on circular water systems and wastewater reuse to reduce freshwater withdrawals, the industry's sustainability challenge evolves from simple "water demand" (quantity) to complex "water compatibility" (quality and chemical treatment).
Challenge
- Visualizing a Conceptual Shift: Translating the abstract argument of "quantity vs. compatibility" into a tangible, mechanical flow so that non-chemists can instantly grasp how recirculating water concentrates salts, metals, and organics.
- Integrating Industry Data: Seamlessly anchoring the theoretical scientific framework with real-world, publicly disclosed 2024 water metrics from tech giants (Google, AWS, Microsoft) without cluttering the primary diagram.
Target Audience & Goals
Geared toward tech executives, policymakers, and environmental engineers. The goal is to reframe how the industry evaluates AI sustainability, clearly illustrating that water reuse is not a free pass—it introduces complex chemical treatment demands (blowdown management) that directly impact local municipal water systems.
Design System
- Categorical Color Blocking: Deployed a strict three-pillar color system to organize the macro narrative flow: deep navy for the digital AI Compute phase, forest green for physical Cooling & Water Systems, and rich purple for the resulting Watershed Consequences.
- Directional Flow Dynamics: Used thick, high-contrast, color-coded arrows (red for heat transfer, blue for freshwater inputs, purple for reclaimed wastewater, and brown for discharge) to guide the viewer's eye logically through the multi-cycle cooling loop.
- Icon-Driven Scorecard: Created a clean, flat-vector icon set (water drop, beaker, recycle symbol, gear, people) along the bottom tier to break down the "Water Compatibility" framework into instantly readable pillars: Quantity, Quality, Reuse, Infrastructure, and Community.